

Jul 10, 2026
May 13, 2026
5 Mins Read
Jul 08, 2026

SOCRadar’s Free Ransomware Intelligence Dashboard: Track Live Ransomware Activity
The ransomware threat intelligence community has been doing incredible work making data more accessible from projects like Ransomware.live, Ransomlook, and CTI.fyi to curated resources like Will Thomas’s Awesome-Ransomware repo on GitHub, there’s a growing ecosystem of free, community-driven tools that help analysts, researchers, journalists, and defenders stay on top of what’s happening.
We love this space, and we wanted to contribute something back to it. So we built a free Ransomware Intelligence Dasboard and put it under SOCRadar Labs, our home for community tools that anyone can use, no account or subscription required. This isn’t a feature locked behind the platform. It’s a standalone, publicly available resource we’re sharing with the community. Here’s what it covers and how you might find it useful.
What Can You See on the Dashboard?
At the top, the dashboard shows key ransomware statistics such as total victims, active ransomware groups, and countries affected. This gives you a quick sense of the scale of ransomware activity without spending time manually collecting numbers from different sources.
The dashboard is also useful because it brings together several views in one place. You can check high-level ransomware numbers, explore activity on a live map, follow recent victim claims, and compare which groups, countries, and industries appear most often.
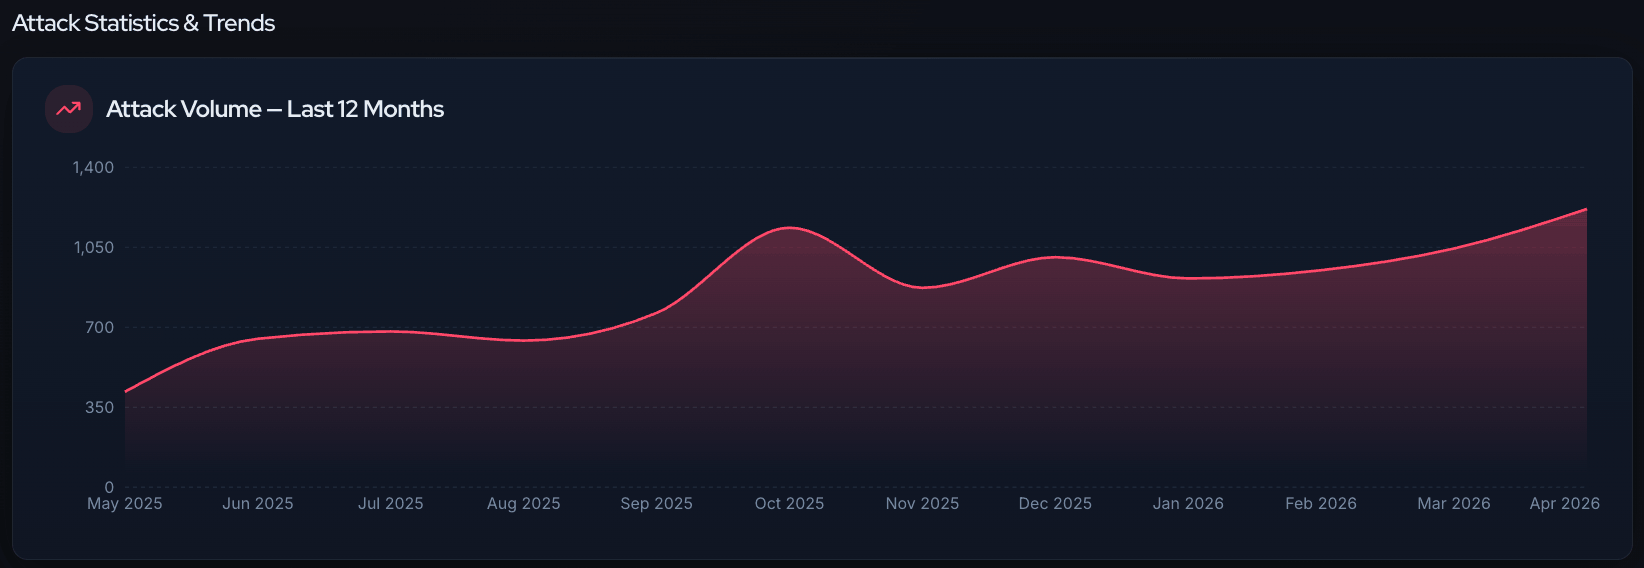
Ransomware attack volume trends help users spot spikes and long-term activity changes
For anyone preparing a quick threat update, writing a ransomware-focused article, or checking sector exposure, this makes the research process much easier.
Where Is Ransomware Activity Happening?
The live map is one of the most useful parts of the page. It helps show where ransomware-related activity is being reported globally, with visible clusters across different regions. For teams preparing threat briefings or regional risk updates, this kind of visual context can quickly show whether ransomware activity is concentrated in certain countries or spreading across multiple areas.
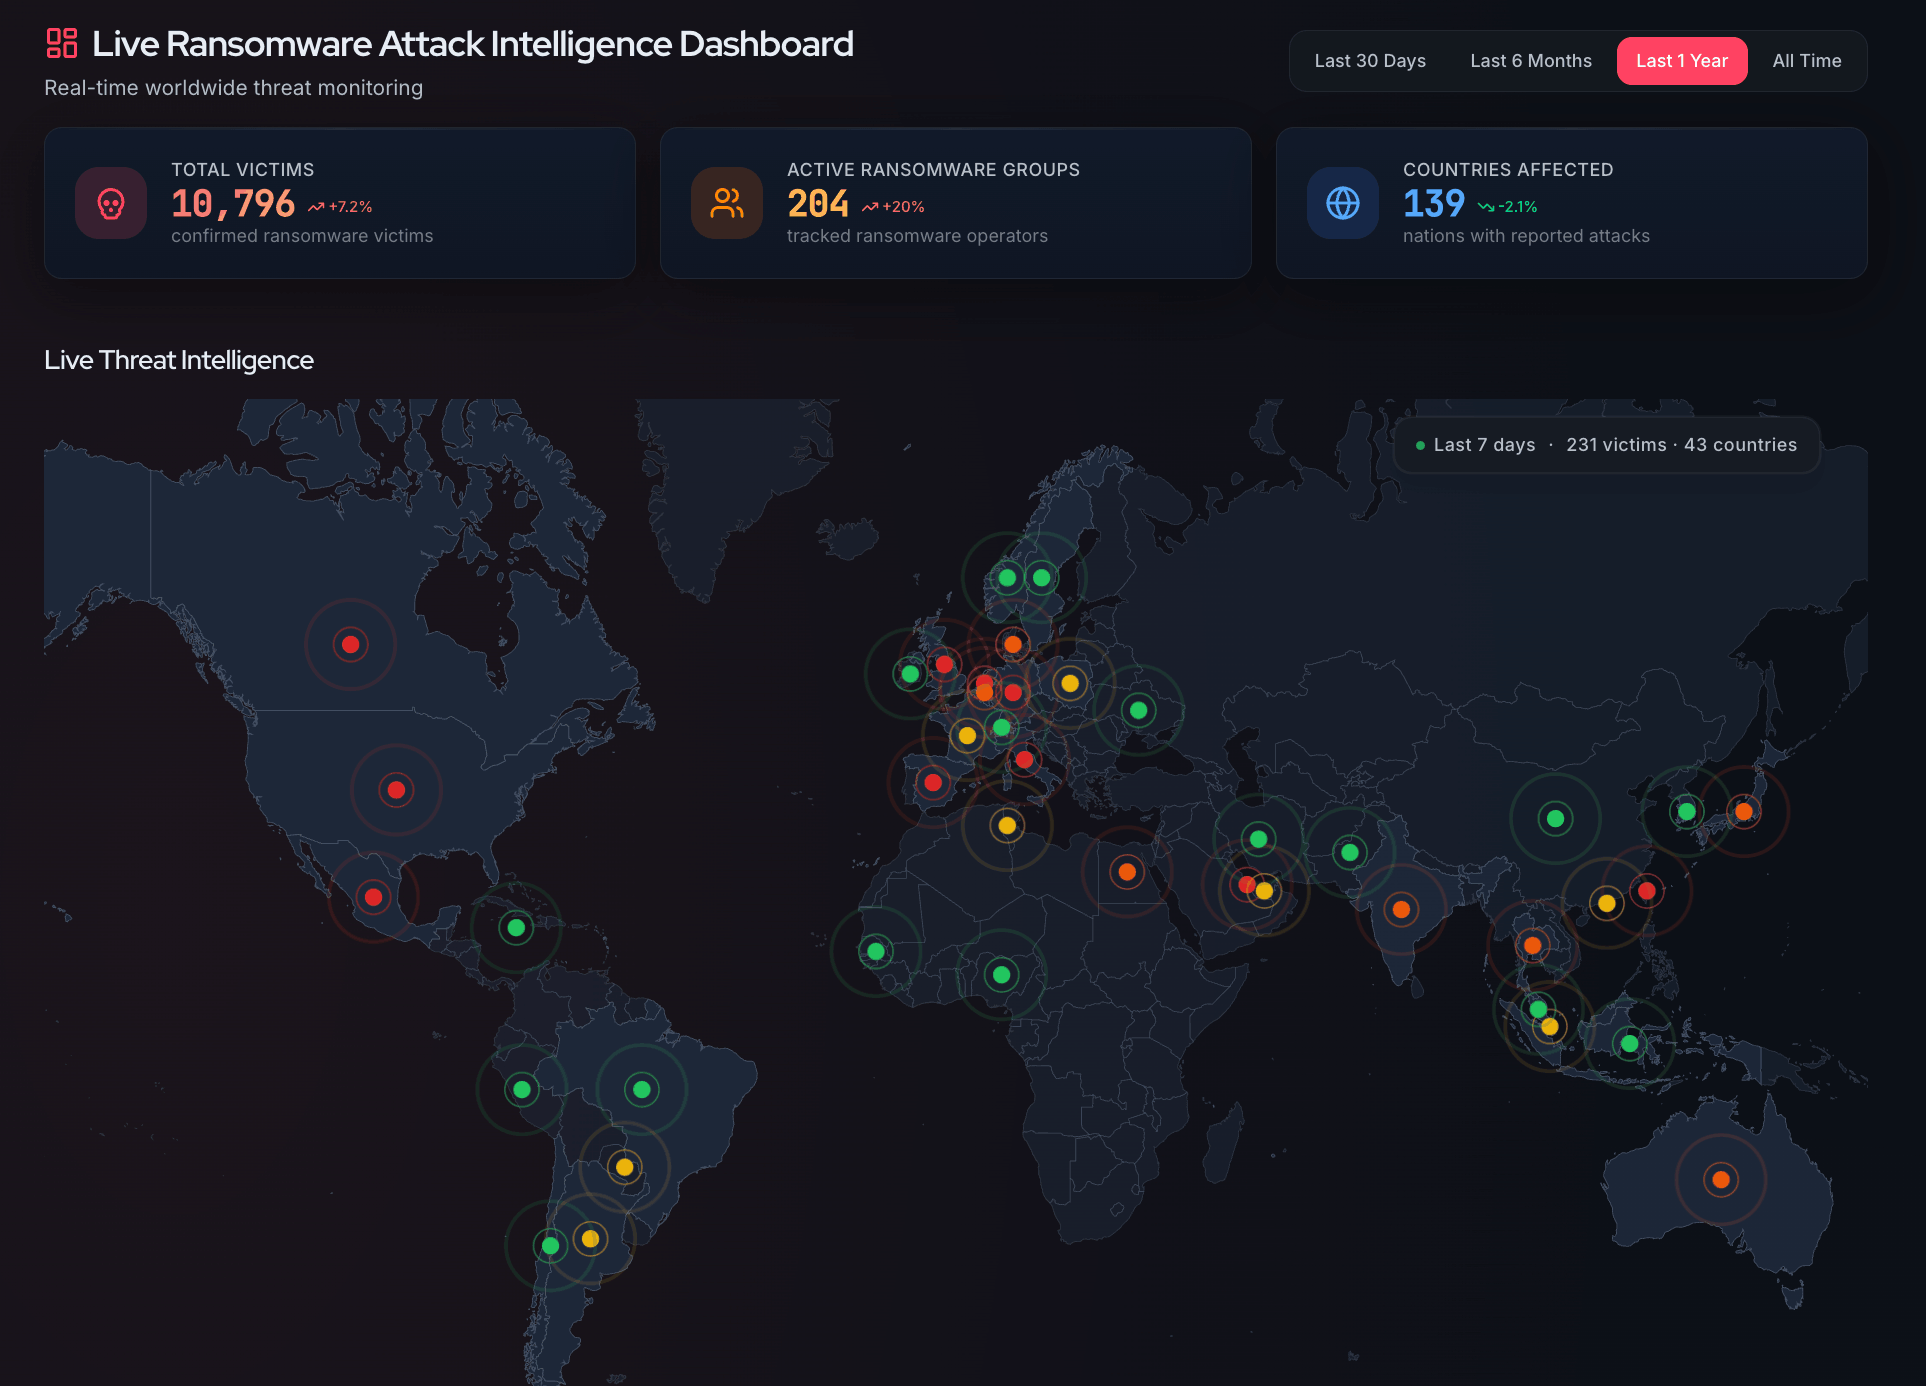
The live map helps users quickly see where ransomware activity is concentrated
This is especially helpful when you want to move beyond raw numbers. A map makes the activity easier to understand at a glance, especially when you are looking at regional targeting, country-level exposure, or the global reach of ransomware campaigns.
Which Victims Are Being Claimed Right Now?
The dashboard also includes a Live Attack Feed, where recent victim claims are listed with details such as organization name, country, ransomware group, industry, status, severity, and how recently the claim appeared. This is useful when you want to follow new ransomware claims as they surface rather than waiting for a weekly or monthly summary.
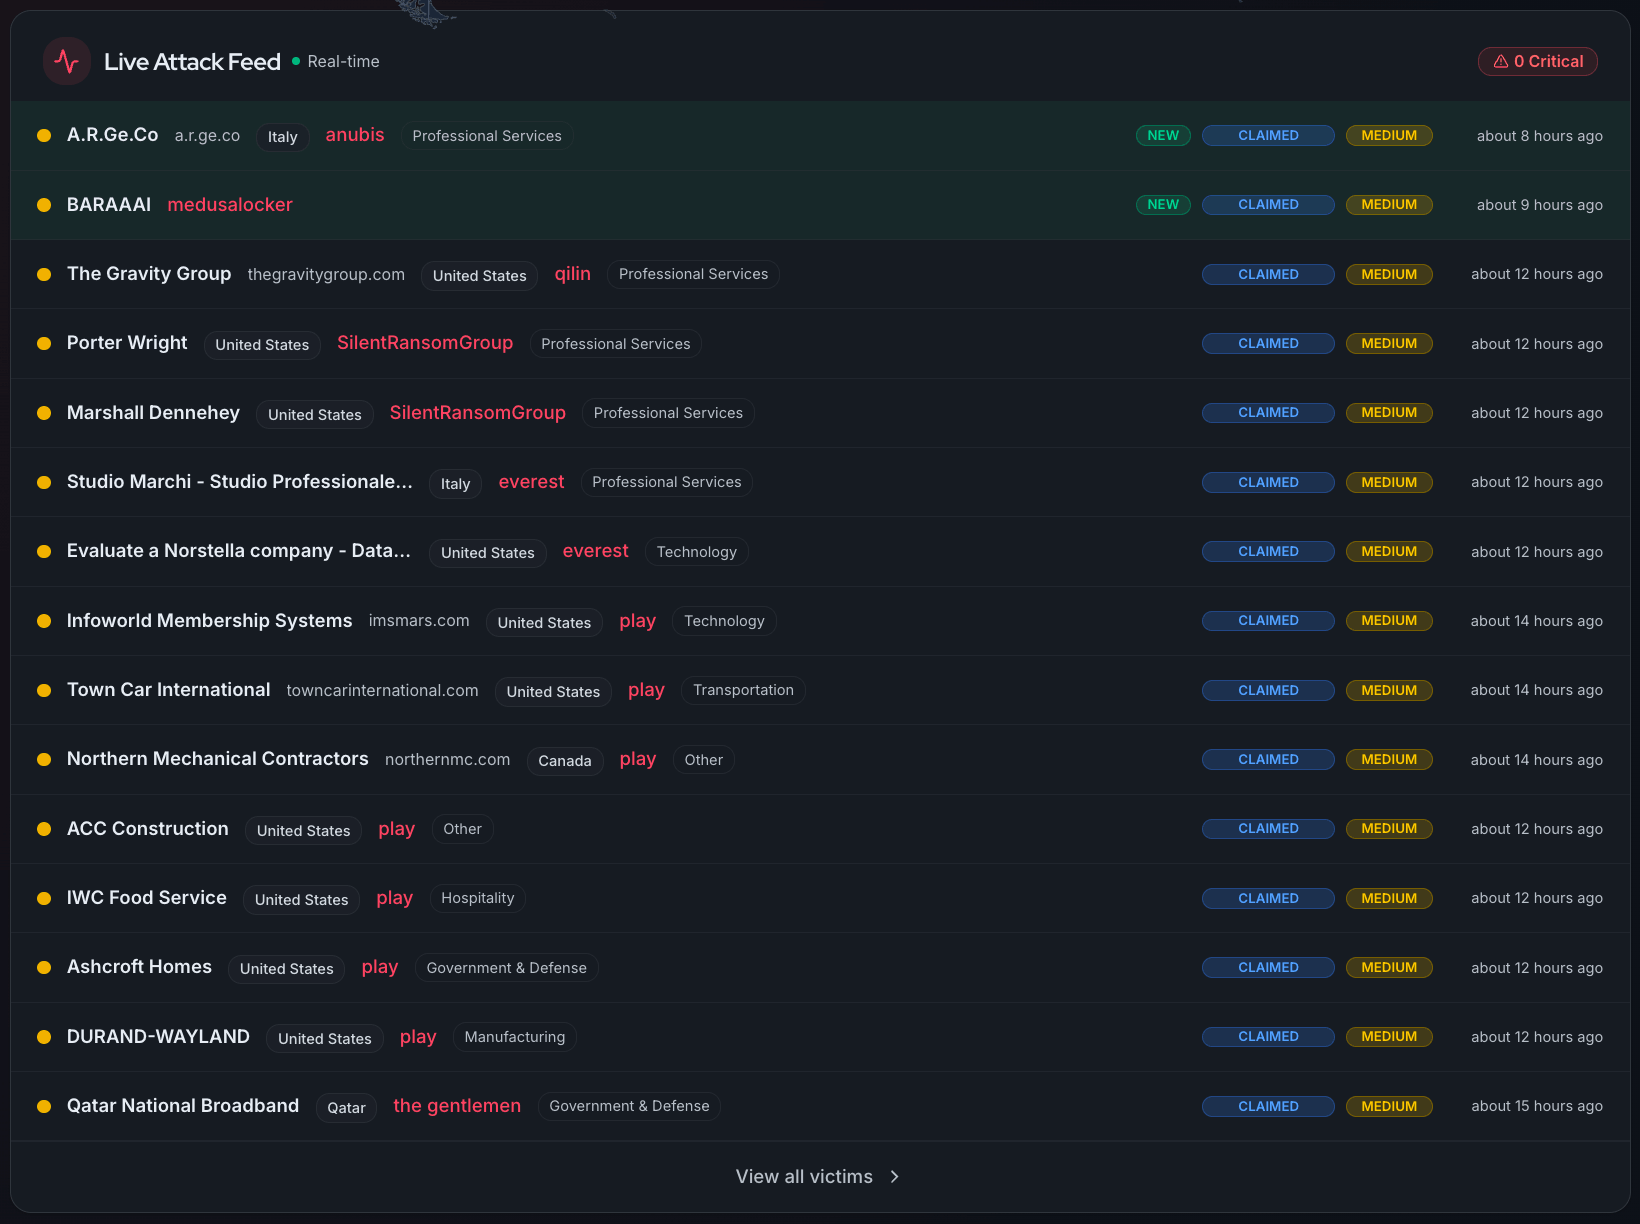
The Live Attack Feed shows recent ransomware victim claims as they appear
The feed can support different use cases. A threat analyst can monitor newly claimed victims, a researcher can track activity by group, and a content team can use it as a starting point for ransomware trend coverage. Since the entries include useful context, you do not have to start from a blank page when checking what happened.
Which Groups, Countries, and Industries Are Most Affected?
The page also breaks down the top ransomware groups, most targeted countries, and most targeted industries. These rankings help answer practical questions like which ransomware groups are most active, which countries are seeing the highest number of claims, and which sectors are being targeted most often.
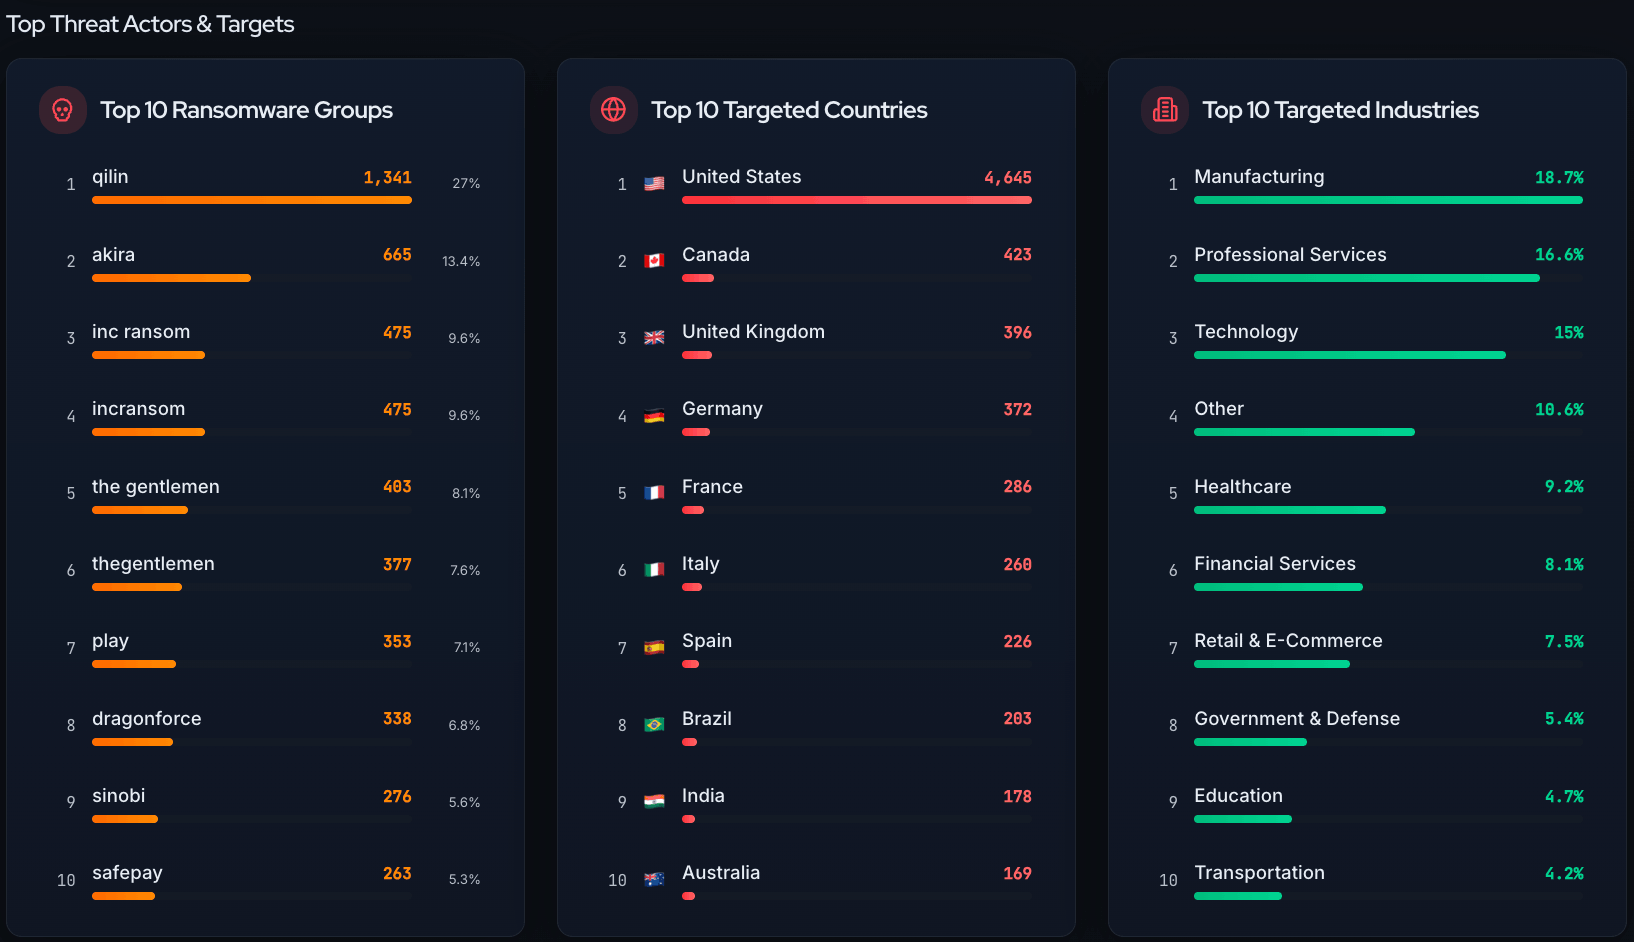
Users can compare leading ransomware groups, targeted countries, and affected industries
For example, a manufacturing company can quickly check whether its industry is among the most affected sectors. A regional security team can look at country-level activity. A threat analyst can monitor which ransomware groups are gaining visibility over time.
Why Use SOCRadar’s Free Ransomware Intelligence Page?
The main benefit is speed. Instead of jumping between multiple sources, you can use one page to get a cleaner ransomware activity overview. It is useful for quick research, security awareness, threat briefings, and keeping track of the ransomware landscape without needing a paid tool just to understand the basics.
In short, SOCRadar’s free Ransomware Intelligence Dashboard gives you a simple way to follow ransomware activity as it develops. Whether you are checking active groups, monitoring victim claims, reviewing industry exposure, or looking at global ransomware trends, it gives you a practical place to start.
Try the free dashboard here:https://socradar.io/free-tools/ransomware-intelligence
Table Of Content
SOCRadar’s Free Ransomware Intelligence Dashboard: Track Live Ransomware Activity
What Can You See on the Dashboard?
Where Is Ransomware Activity Happening?
Which Victims Are Being Claimed Right Now?
Which Groups, Countries, and Industries Are Most Affected?
Why Use SOCRadar’s Free Ransomware Intelligence Page?
Related Articles

Top 10 MSSPs in Saudi Arabia in 2026
Top 10 Cyber Threat Exposure Management Platforms
Jul 10, 2026


Top 10 MSSPs in Brazil in 2026
Jun 26, 2026