

Sep 07, 2026
Oct 06, 2026
7 Mins Read

Summarize with:
Investigate SOCRadar Alarms Where Your Analysts Already Work, with SOCRadar and Elastic
Your SOC runs on Elastic. Detections, logs, cases and dashboards all live in Kibana, and your analysts have built their muscle memory around it. Then an impersonating domain, a leaked credential or a newly exposed asset shows up in a different console, and the investigation starts with a copy-paste. What if the external threat landscape arrived in the same place as everything else?
External Intelligence That Lives Outside the SIEM Is Intelligence That Waits
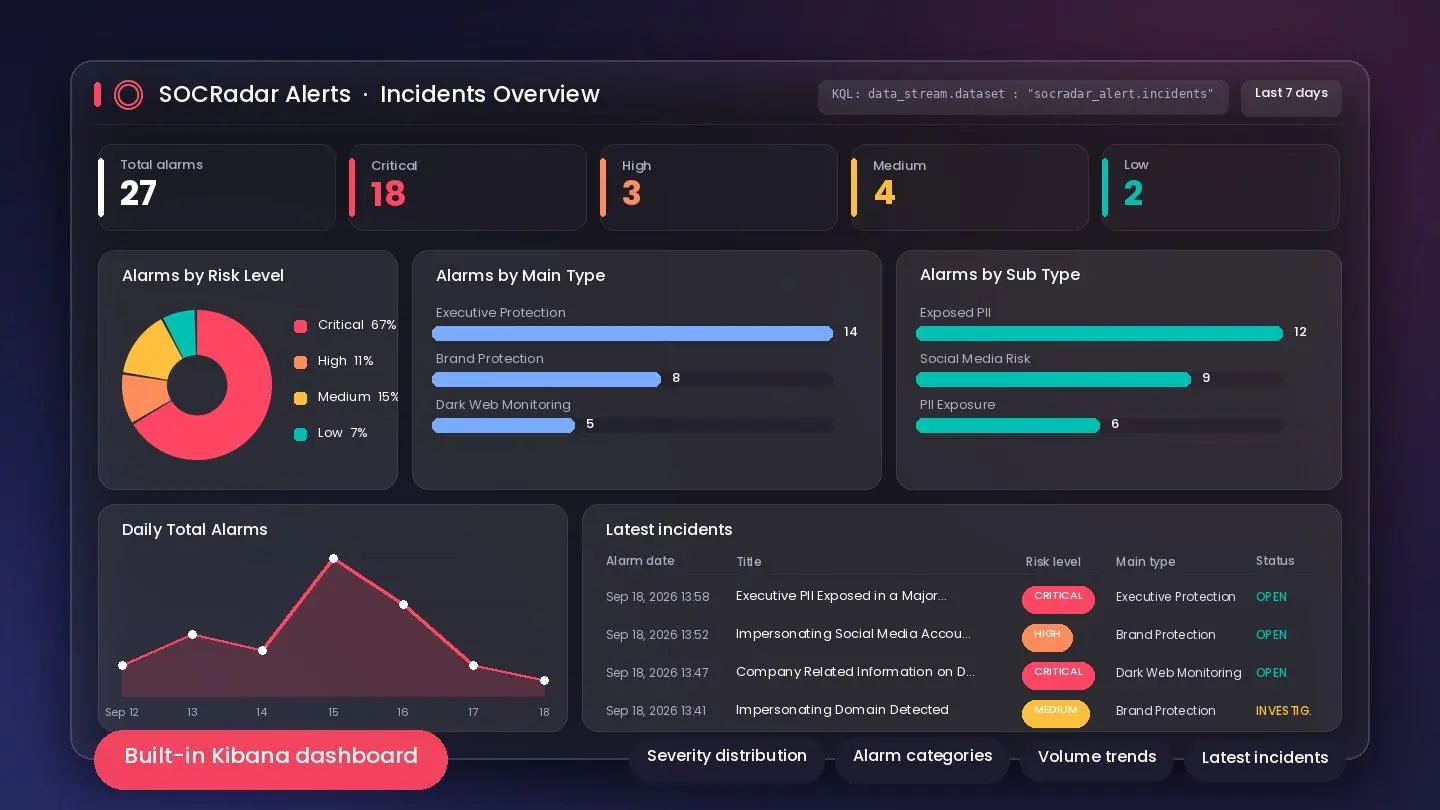
The SOCRadar Alerts integration ships with a built-in Kibana dashboard: severity distribution, alarm categories, volume trends and recent incidents.
Most security teams already have external threat intelligence. The problem is where it ends up. Alarms about the Surface, Deep and Dark Web, about brand abuse or about the external attack surface are generated in a dedicated platform, reviewed by whoever owns that console, and then manually re-keyed into the SIEM or the case tool when they turn out to matter.
That handoff costs time in two ways. First, every alarm needs a human to carry it across the boundary, so volume quickly becomes a bottleneck. Second, the context that makes an external alarm actionable, such as the affected asset, the related entities or the alarm’s current status, is often lost in the copy, leaving the SIEM analyst with a title and little else.
Severity Means Nothing If Every Tool Scores It Differently
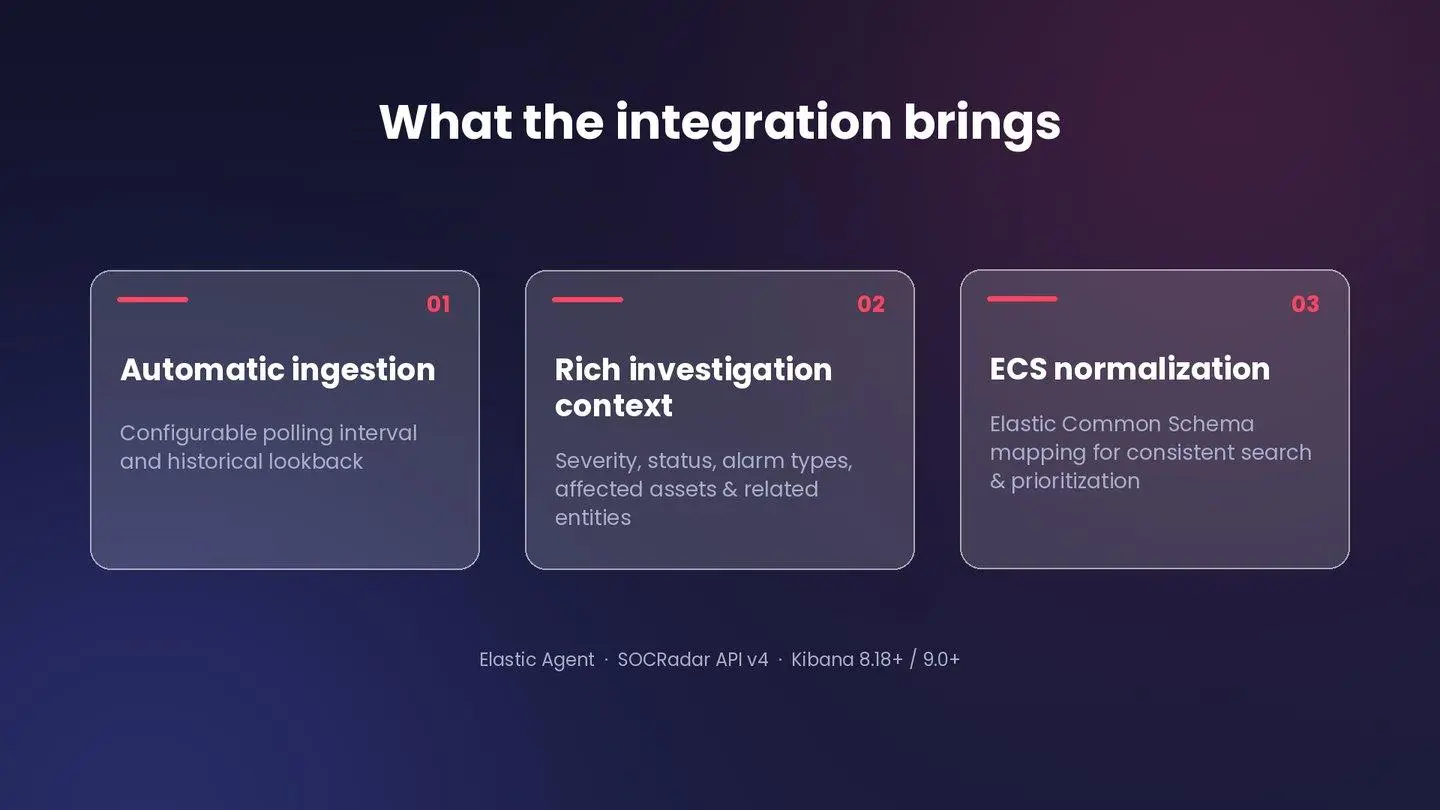
Each SOCRadar alarm arrives in Elastic with severity, status, alarm types, affected assets and related entities, mapped to ECS.
The integration is powered by SOCRadar’s alarm engine, which correlates findings from Cyber Threat Intelligence, Brand Protection and External Attack Surface Management into prioritized, validated alarms. Each alarm carries a severity, a status, an alarm type and sub-type, the affected asset and any related entities. Use cases covered include:
- Impersonating domains, social media accounts and mobile apps targeting your brand
- Leaked credentials and exposed data discovered on the Deep and Dark Web
- Newly discovered or changed external assets and risky exposures
- Vulnerability intelligence tied to your discovered assets
- Threat actor and campaign chatter that references your organization
Integration with Elastic
The new SOCRadar Alerts integration (v0.1.0) is available natively in Elastic Security through the Elastic integrations catalog.
What flows into Elastic: The integration collects SOCRadar alarms through the SOCRadar API on a configurable polling interval, with an initial historical lookback so your first run backfills recent alarms. Each alarm arrives with its severity, status, alarm types, affected assets, related entities and alarm details.
How it is shaped: Alarm data is mapped to the Elastic Common Schema (ECS), so SOCRadar severity and fields sit next to your other sources with consistent names. Your analysts can search, filter and build rules on external alarms exactly as they do on internal telemetry, and prioritize by severity across both.
What analysts can now do in Kibana: The integration ships with a built-in Kibana dashboard that shows severity distribution, alarm categories, volume trends and recent incidents. Analysts can pivot from a dashboard tile to the underlying alarm documents, correlate them with endpoint or identity events in the same workspace, and open cases without leaving Kibana.
Three SOCRadar integrations in Elastic: With this release, Elastic customers have three native SOCRadar integrations to choose from, depending on the data they need:
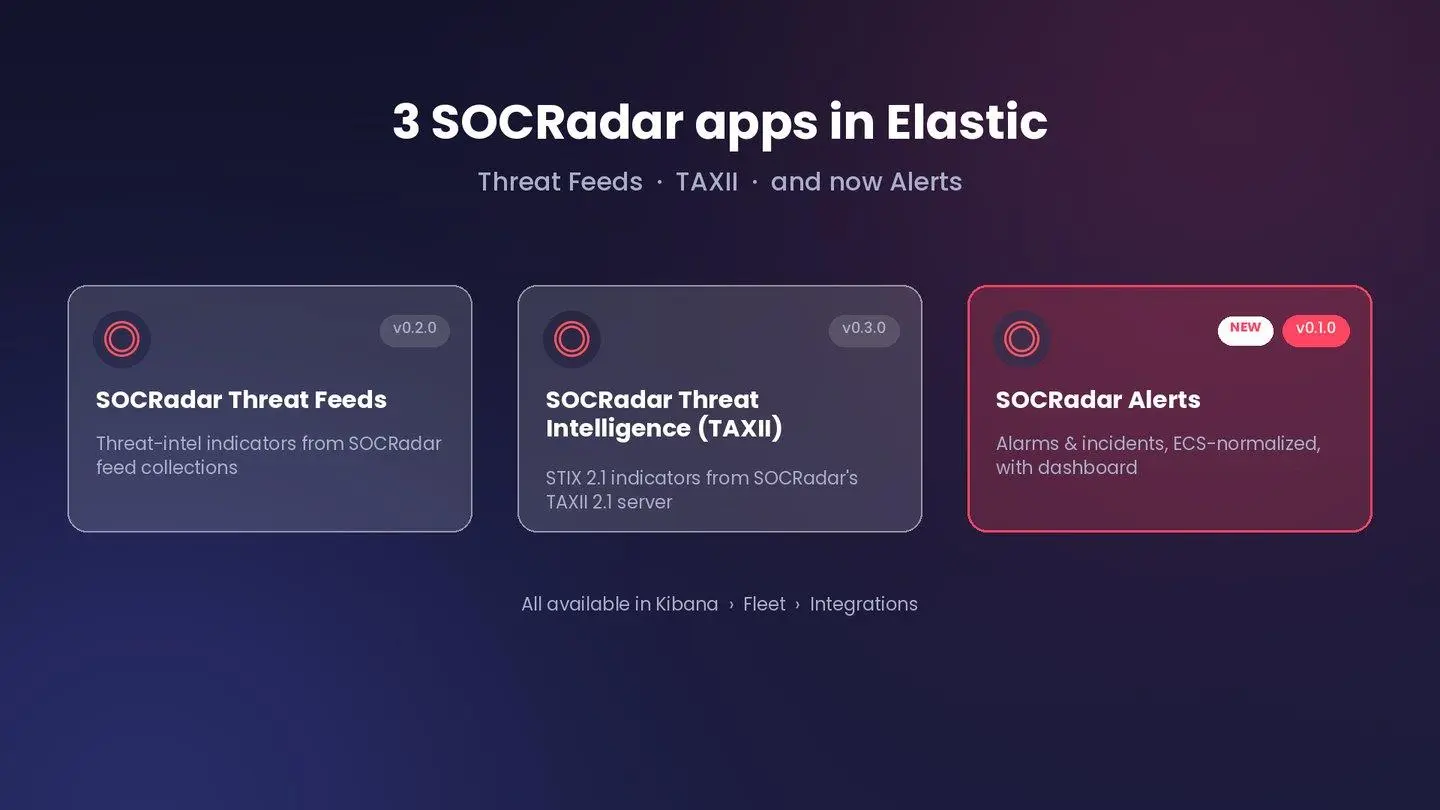
Three native SOCRadar integrations in Elastic: Threat Feeds, Threat Intelligence (TAXII) and the new SOCRadar Alerts.
- SOCRadar Threat Feeds (v0.2.0): threat intelligence indicators from SOCRadar feed collections
- SOCRadar Threat Intelligence / TAXII (v0.3.0): STIX 2.1 indicators from the SOCRadar TAXII 2.1 server
- SOCRadar Alerts (v0.1.0), new: alarms and incidents with a built-in Kibana dashboard
Indicators from the first two feed your detection rules; alarms from the third give your analysts the validated, asset-aware findings to investigate.
How It Works in Practice
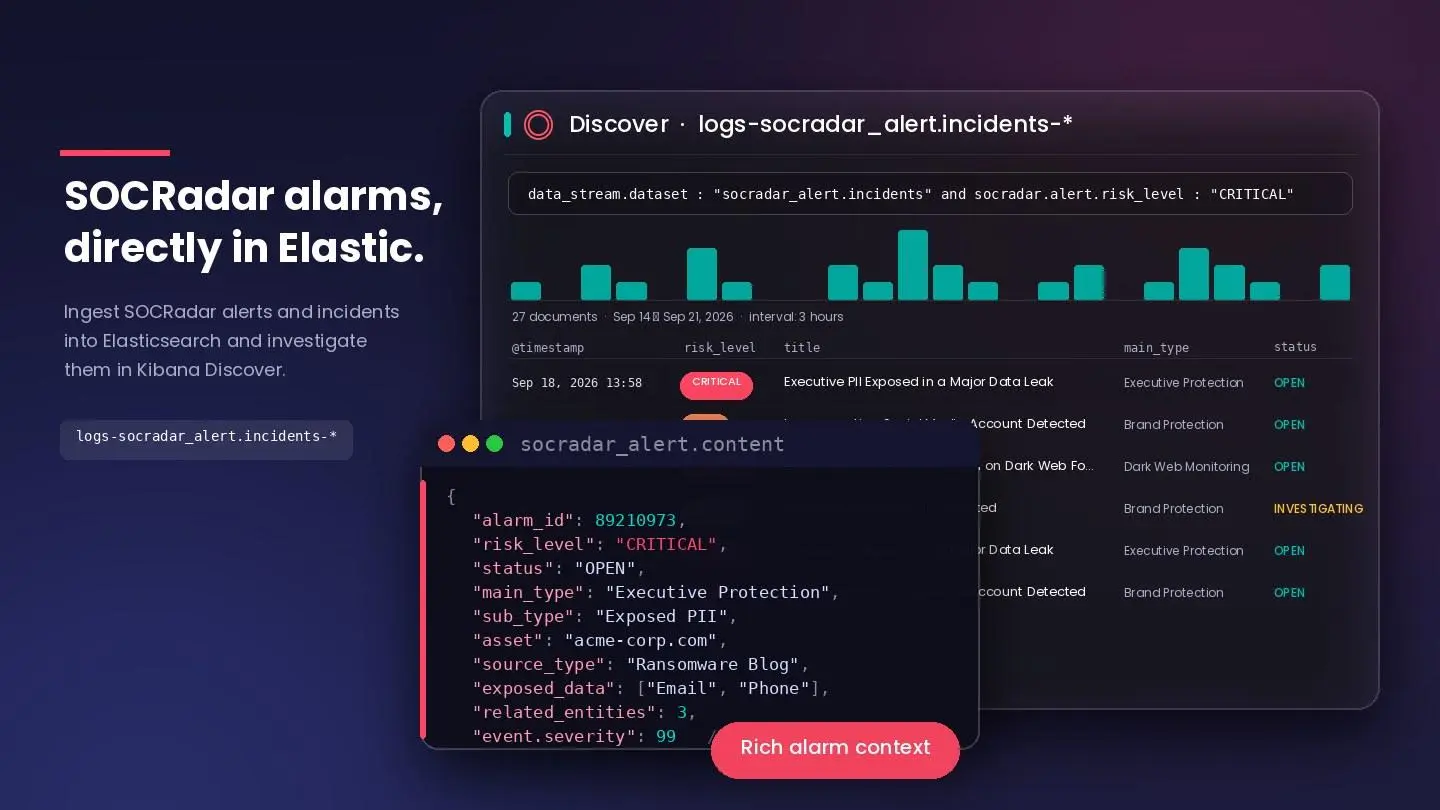
SOCRadar alarms, investigated in Kibana next to the rest of your telemetry.
It is Tuesday morning and the SOCRadar Alerts dashboard in Kibana shows a spike in high-severity alarms overnight. You open the recent incidents panel and see a “New Digital Asset Discovery” alarm for a subdomain nobody on your team recognizes, followed an hour later by an “Impersonating Domain” alarm using a look-alike of your main brand.
Because both alarms are ECS-normalized, you filter your authentication logs by the same time window and the related entities SOCRadar attached to the alarm. A handful of logins to the unknown subdomain stand out. You open a case in Kibana, attach the two SOCRadar alarm documents and the login events, and hand it to the responder on shift. Nothing was copied between consoles, and the external context that triggered the investigation is already in the case.
Take the Next Step
For mutual customers, the combination is simple: SOCRadar supplies validated, prioritized external alarms, and Elastic puts them in the workspace your analysts already use, with the schema and dashboards to act on them.
To get started, open the Integrations catalog in your Elastic deployment, search for SOCRadar, and add the SOCRadar Alerts integration with your SOCRadar API credentials and polling preferences. If you are not yet a SOCRadar customer, or want help configuring the three integrations together, contact your SOCRadar customer success manager or request a demo.
Frequently Asked Questions
What data does the SOCRadar Alerts integration bring into Elastic?
It collects SOCRadar alarms through the SOCRadar API on a configurable polling interval. Each alarm arrives with its severity, status, alarm types, affected assets, related entities and alarm details, mapped to the Elastic Common Schema (ECS).
How is SOCRadar Alerts different from the other SOCRadar integrations in Elastic?
SOCRadar Threat Feeds and SOCRadar Threat Intelligence (TAXII) deliver indicators for detection rules. SOCRadar Alerts delivers validated alarms and incidents, together with a built-in Kibana dashboard for investigation.
Does the integration include a Kibana dashboard?
Yes. The built-in dashboard shows severity distribution, alarm categories, volume trends and recent incidents, and analysts can pivot from any tile to the underlying alarm documents.
How do I set up the SOCRadar Alerts integration?
Open the Integrations catalog in your Elastic deployment, search for SOCRadar, and add the SOCRadar Alerts integration with your SOCRadar API credentials and polling preferences.
Learn more
Table Of Content
Investigate SOCRadar Alarms Where Your Analysts Already Work, with SOCRadar and Elastic
External Intelligence That Lives Outside the SIEM Is Intelligence That Waits
Severity Means Nothing If Every Tool Scores It Differently
Integration with Elastic
How It Works in Practice
Frequently Asked Questions
Related Articles

SOCRadar XTI Is Live on the Chrome Web Store
Jul 16, 2026
Top 10 Cyber Threat Exposure Management Platforms
Jul 10, 2026
What Is FortiBleed? Your Questions Answered
Jun 19, 2026