What is Network Performance Monitoring (NPM)?
Network Performance Monitoring (NPM) is assessing the service quality of a network as experienced by users by measuring, visualizing, monitoring, diagnosing, optimizing, and reporting on it. NPM aims to identify congestion, maximize throughput, and improve network performance for the user.
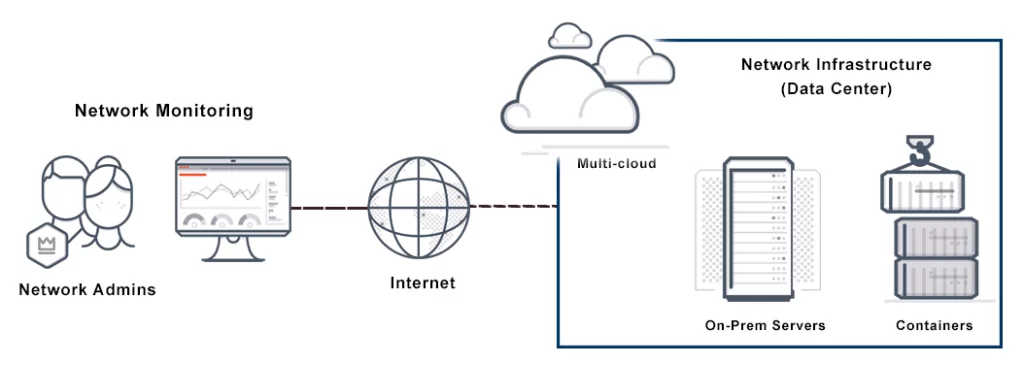
It involves the management of each component of the network infrastructure, such as the links between workstations, servers, virtual devices, and mobile devices.
Any network crashes, damages, or errors, especially for enterprise-level businesses, can result in massive losses that are not always easy to recover. Network performance monitoring allows IT teams to predict probable crashes and take a proactive approach to keep their networks in the best working order.
How Does Network Performance Monitoring Work?

Network Performance Monitoring solutions gather network data, identify and measures network performance variables, perform network assessments, and diagnose network performance issues using automated monitoring tools and software.
NPM tools traditionally collect network data from Simple Network Management Protocol (SNMP), Flow data, and Packet Capture Appliances (PCAP). Modern NPM solutions also can ingest and analyze cloud flow logs created by cloud-based systems (such as AWS, Azure, and Google Cloud). Each source provides a distinct perspective on the problem. When all the information is combined, it gives a complete understanding of the health of your network and the applications running on it.
Flow Data
Flow data gives critical information generated from relevant network devices such as routers or switches. Flow data analytics provides insight into communication channels, what sort of data was shared across communication channels, to whom the data was transferred, and other meaningful information regarding the logistics of the data movement.
SNMP
All network devices are monitored using the Simple Network Management Protocol (SNMP). When networks and systems experience outages or failures, SNMP protocols notify IT teams and provide them with the information they need to resolve their network issues before they escalate. SNMP can inform IT staff, about performance indicators like memory, CPU, network errors, and packet loss.
Packet Capture
Packet capture gathers and stores data packets as they travel across the network. When packages are captured and stored, they can aid in troubleshooting, identifying vulnerabilities, clarifying capacity issues, and providing detailed forensic analysis when errors or problems occur.
VPC (Virtual Private Clouds) Flow Logs
Cloud-based applications, systems, and virtual private clouds can export network flow data like flow records generated by network infrastructure components. VPC Flow Logs capture a subset of network flows sent from and received by various cloud infrastructure components (such as virtual machine instances or Kubernetes nodes). These can be ingested by an NPM solution to provide cloud-based network monitoring and analytics.
NPM demands multiple types of measurement or monitoring data on which engineers can execute diagnoses and analyses. Example categories of NPM monitoring data are:
- Bandwidth: Measures the raw versus the available maximum rate at which information can be transferred through diverse network points or along a network path.
- Throughput: Measures the amount of information being transferred.
- Latency: Measures network delays from the view of clients, servers, and applications.
- Errors: Measures raw numbers and rates of errors such as Transmission Control Protocol retransmissions, out-of-order packets, and packet losses.
Network Performance Monitoring vs. Network Performance Management
Since the terms “network performance management” and “network performance monitoring” are highly similar, it is quite possible to want to use them interchangeably, but they are not identical.
Network performance management includes network performance monitoring. Management is what happens after an evaluation of the collected data; it is a set of policies, procedures, workflows, and responsibilities assigned to improve or maintain optimal performance. NPM involves watching and collecting data, while network performance management makes decisions based on the review’s findings.
Network performance monitoring is an essential component of effective network performance management. Identifying the root cause of problems is critical for mitigating their consequences and preventing future occurrences. Both concepts work synergistically, but each employs techniques, resulting in specific results.
NPM solutions can analyze a network’s performance in real-time, chronologically, or even predictably. NPM solutions can also help understand the quality of end-user experience by analyzing network performance data, particularly data from active, synthetic testing.
Conclusion
Modern IT infrastructure is more complicated than ever, with numerous components that collaborate to increase network speed and productivity while providing a positive user experience. When one component fails, the consequences can be far-reaching, and determining the source of the resulting problems can be complicated with so many moving parts.
By monitoring performance data in real-time or reviewing performance records, IT teams can identify the root cause of problems before they cause outages or a poor user experience. End-to-end visibility and actionable analytics enable proactive management of network-based performance issues.
References
- https://www.appdynamics.com/topics/what-is-network-performance-management#~2-what-are-the-elements-of-npm
- https://www.atatus.com/glossary/network-performance-management/
- https://www.heavy.ai/technical-glossary/network-performance-monitoring
- https://www.sumologic.com/glossary/npm-network-performance-monitoring/
- https://www.kentik.com/kentipedia/network-performance-monitoring/


